Memory leaks are a source of great frustration and cost to Software and DevOps Engineers alike. They can cause an application to use far greater resources than necessary, slowing it down or resulting in a much higher cost to run. It can also be tricky to find the root cause of a memory leak, especially when it only seems to occur after running for an extended period of time in the production environment.
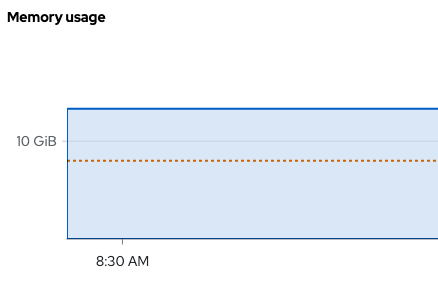
When running applications in OpenShift, the admin is presented with a quick memory usage console. Occasionally, looking at this metric can alert the admin to a potential memory leak or general overuse. When seeing something like the below image in a Pod's 'Metrics' tab, it can be very confusing as to why the pod is consuming more memory than previously configured.
In order to diagnose the root cause of the potential memory leak, or otherwise determine that there is no leak, it is possible to use go's pprof. There are three steps necessary to profile a go application running on OpenShift with pprof:
Enable PProf in the application
The first step to utilizing pprof to detect memory usage and leaks is to enable it in the go application. In order to do this, pprof endpoints must be served in the application, and the appropriate memory profiles must be written. This opens up the ability for pprof to view the memory usage of the application, and serve it on an endpoint that can be accessed for further analysis.
Port Forward from the production pod
OpenShift's port-forward command makes it possible to execute pprof locally to profile the memory usage in your go application. In order to utilize this, it is necessary to forward the port that pprof is being served on from the specific pod that needs profiling. '6060' is the default pprof port; the following command forwards that port to local '6060':
oc port-forward pod/<pod-name> 6060:6060 --as system:admin
Obtain the memory profile
The final step is to use pprof locally to view the memory profile. PProf has many options to do this, but probably the most useful is the web interface as it is scrollable and zoomable. The most common use case is to view the 'heap' profile, but other options are available. In order to start up pprof locally use the following command:
go tool pprof http://localhost:6060/debug/pprof/heap
Then, simply type 'web' to open a snapshot of the current memory usage with the web interface. The following image is an example of what this will look like.
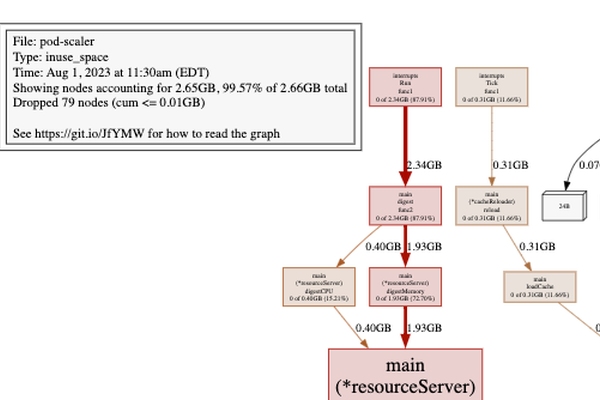
From this point, it is possible to determine the specific memory usage of the application, and determine the location of the potential leak.